This guide explains how to use Front Office Reports to review dashboard-level front-desk activity and then drill into enquiry, visitor, call, postal, and complaint report tabs.
Before you start
- Decide whether you need a fast dashboard overview or one detailed report branch.
- Prepare a date range before leaving the dashboard, because the detailed tabs use date-based filtering and CSV export.
- Expect different filter sets on each tab because enquiry, visitor, call, postal, and complaint reporting do not share the same dimensions.
- Treat the dashboard as a monitoring surface and the non-dashboard tabs as operational analysis surfaces.
Navigation path
Reports -> Front Office Reports
Step 1: Open the workspace and start on the dashboard
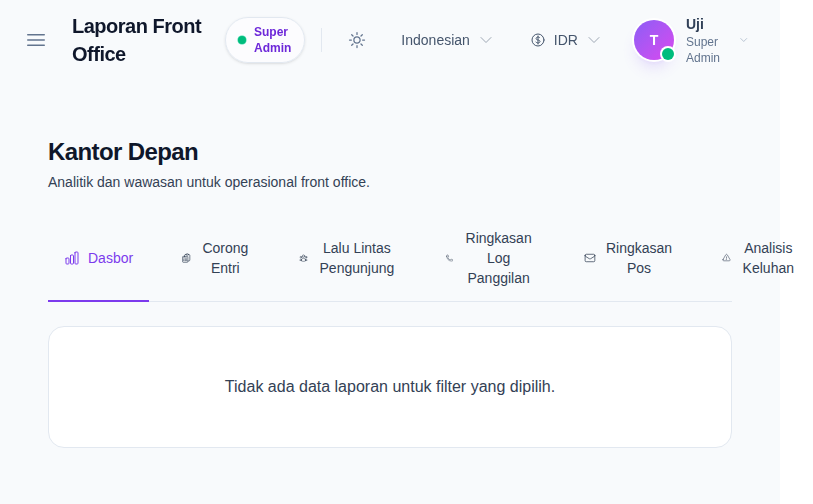
Open Front Office Reports from the Reports menu. The page starts on the Dashboard tab, which is designed for a fast operational overview rather than granular filtering.
The dashboard tab is separate from the analytical branches:
- Dashboard
- Enquiry Funnel
- Visitor Traffic
- Call Log Summary
- Postal Summary
- Complaint Analysis
Step 2: Use the dashboard for quick operational signals
When dashboard data is available, the workspace can show cards for current-month activity and pending operational items such as:
- enquiries this month
- visitors this month
- calls this month
- postal this month
- complaints this month
- active enquiries
- overdue follow-ups
- pending complaints
If the local dataset does not currently produce report output, the dashboard can correctly show an empty-state panel instead of KPI cards. That state is still valid and should be documented as part of the real behavior.
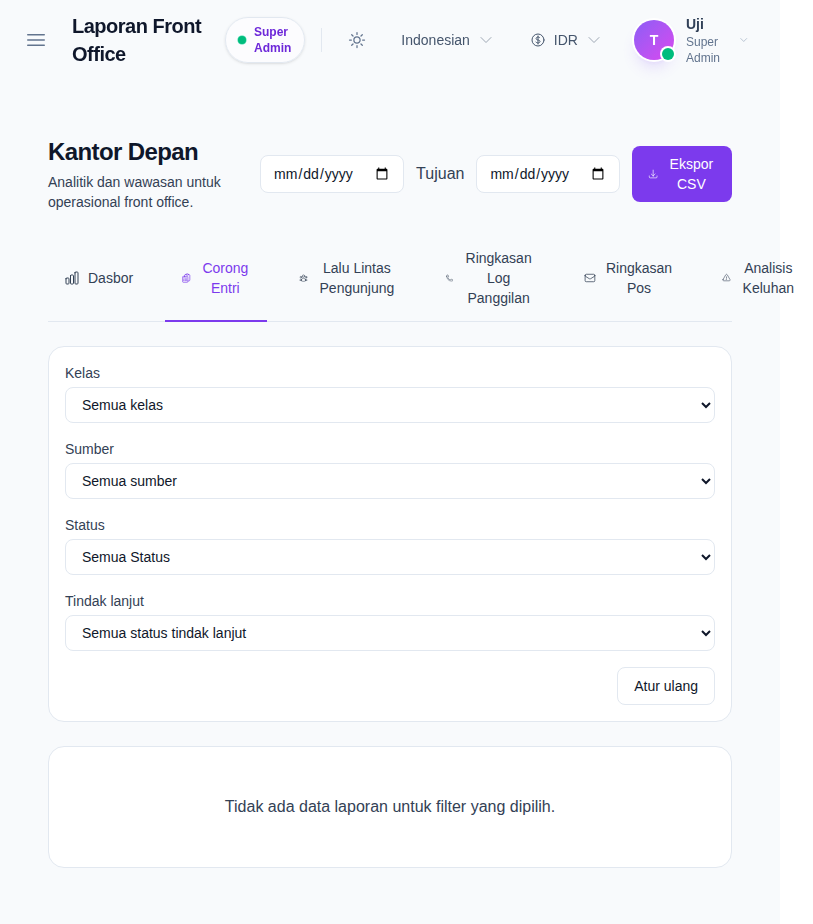
Step 3: Switch to a detailed tab and apply the correct filter set
Once you move away from the dashboard, the top-right action area exposes:
- From date
- To date
- Export CSV
Each detailed tab also shows its own filter block. Examples from the current workspace:
- Enquiry Funnel: class, source, status, follow-up state
- Visitor Traffic: purpose, host
- Call Log Summary: call type, follow-up state, follow-up date range
- Postal Summary: postal type, attachment state
- Complaint Analysis: complaint type, source, assigned owner, resolution state
Use only the filters that belong to the active tab. The workspace clears irrelevant filters when you move to another branch.
Step 4: Read the detailed tab in context
Each non-dashboard tab is designed around a different operational question:
- Enquiry Funnel focuses on totals, conversion metrics, follow-up breakdown, status breakdown, and recent enquiry preview rows
- Visitor Traffic summarizes total visitors, staff versus student meetings, purpose counts, and recent visitor rows
- Call Log Summary emphasizes call volume, call-type split, follow-up workload, duration, and recent log rows
- Postal Summary tracks dispatch versus receive volume, attachment state, and recent postal records
- Complaint Analysis shows complaint totals, status or type breakdowns, assignment state, and recent complaint rows
Where detail preview rows are available, use them as the bridge between a report aggregate and the operational workspace that owns the underlying records.
Step 5: Export only after the tab and filters are final
The current UI allows CSV export only on non-dashboard tabs.
Export after:
- choosing the correct detailed tab
- setting the date range
- applying the tab-specific filters
This keeps the exported CSV aligned with the exact report slice you reviewed on screen.
Verify the result
Use this checklist after the review:
- confirm you are on the correct report branch before interpreting the data
- confirm the date range matches the reporting window you intended
- confirm the branch-specific filters match the operational question you are answering
- confirm the CSV export, if used, reflects the same tab and filters shown on screen
Expected result: you can move from a front-office overview into one focused report branch, apply the right filters for that branch, and export a CSV that matches the current analytical view.
Troubleshooting
| Issue | Likely cause | What to do |
|---|---|---|
| The dashboard shows an empty panel | The current local dataset has no report output for the dashboard | Confirm whether front-office source records exist before assuming the report is broken |
| Export is missing | You are still on the Dashboard tab | Switch to a detailed tab to expose the date range and CSV export controls |
| The filters changed after switching tabs | The workspace drops filters that do not belong to the new branch | Recheck the current branch and reapply only the relevant filters |
| The tab still shows no records | The selected date range or branch-specific filters are too narrow | Broaden the date range or reset the tab filters |
| The data is useful but you need operational follow-up | You are still on the report surface | Use the linked workspace actions where available to open the underlying front-office records |